The Walk Lab tested wastewater samples from Big Sky, West Yellowstone, and Three Forks, Montana between June and October 2020.
We are tracking the presence and abundance of the SARS-CoV2 virus in wastewater samples using a kit designed by the US Centers for Disease Control and Prevention (CDC 2019‐Novel Coronavirus (2019‐nCoV), Real‐Time RT‐PCR Diagnostic Panel). Importantly, this test kit was originally designed to detect the virus in human samples and NOT wastewater or other kinds of environmental samples. Therefore, our results represent an adaptation of the test’s original purpose and so results should be interpreted with caution. We provide our interpretation of results in weekly reports based on previous sampling experience and training in molecular biology techniques.
Composite samples are collected over a 24-hour period using an automatic sampling device (ISCO autosampler) so they better reflect total wastewater in the system. Each samples is split and processed as three independent replicates to provide confidence in observed results. Tests are performed on each replicate to identify two independent locations on the SARS‐CoV2 genome (referred to as N1 and N2). Raw data are recorded as cycle threshold (Ct) numbers that correspond to the number of PCR cycles required to observe a signal in the test. The larger the Ct number, the lower the amount of virus in the sample. Per guidelines in the CDC kit, only Ct numbers <40 are recorded as this is the recommended cut-off. A standard curve is also generated using pre‐made targets for the N1 and N2 locations and used to calculate the number of genomes in each sample per liter of sample.
Weekly results for Big Sky, West Yellowstone, and Three Forks can be found by clicking on dates in the table below. Trends in viral levels in Big Sky and West Yellowstone are graphed and updated weekly along with numbers of confirmed cases.

Big Sky, MT: The figure above shows estimated SARS-CoV-2 levels in wastewater of the town of Big Sky, MT over time (graph will be updated weekly). Weekly wastewater testing was initiated on May 14, 2020 and began showing virus on June 6, 2020 at our detection limit. Individuals with confirmed COVID-19 in Big Sky reported symptoms beginning on June 5, 2020. Virus levels since that time have increased and remain positive. SARS-CoV-2 results (dots) shown for nucleocapsid gene targets 1 and 2 (N1 and N2) represent the median of 2-3 replicate samples (each with 2 technical qPCR replicates) on each date (error bars = 95% confidence limits; some dots completely cover error bars). LOD = limit of detection
Interpretation. Samples taken since June 6 showed increased signal of virus compared to previous weeks. The sample on June 16, 2020 was clearly positive and the sample on June 23, 2020 was significantly increased. According to the N1 target, virus levels in July remained positive and generally increased. Virus levels in wastewater and the number of positive cases dropped off in August. The N2 target appears to be variable, but positive nonetheless and tracks well with N1 detection. These results add further support that the presence of virus in wastewater is a useful indicator of circulating virus in the community and the onset of confirmed cases. At the end of testing, signal in wastewater was rising.
________________________________________________________________________
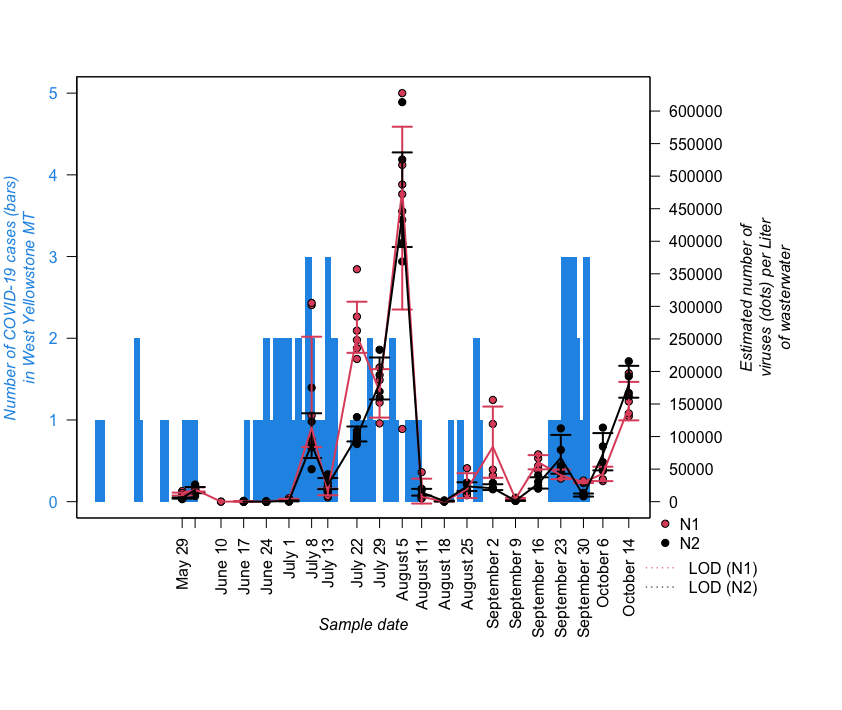
West Yellowstone, MT: The figure above shows the number of confirmed COVID-19 cases (left axis) and estimated SARS-CoV2 levels in wastewater (right axis) in the town of West Yellowstone, MT over time. Weekly wastewater testing was initiated on May 28, 2020 and is still in progress (graph will be updated weekly). COVID-19 cases (bars) refer to laboratory confirmed cases as reported by the Gallatin City/County Health Department since the onset of patient testing in March 2020. SARS-CoV2 results (dots) shown for nucleocapsid gene targets 1 and 2 (N1 and N2) represent the median of 2-3 replicate samples on each date (error bars = 95% confidence limits; some dots completely cover error bars). LOD = limit of detection
Interpretation. Virus was detected in wastewater on May 28, 2020 and coincided with new confirmed cases in the community of West Yellowstone on May 30, May 31, and June 2. Virus levels returned to very low and sometimes undetectable levels until June 22, 24, and 27, 2020 when new cases were reported followed by increased signal in wastewater on June 24, 2020 and significantly increased levels on July 1, 2020. Levels in wastewater continued to rise through July but drop off in August as case numbers were sparse. Virus detection in wastewater seems to be directly correlated with new confirmed cases. We will continue to monitor this trend.
________________________________________________________________________

Three Forks, MT: The figure above shows the number of confirmed COVID-19 cases (left axis) and estimated SARS-CoV2 levels in wastewater (right axis) in the town of West Yellowstone, MT over time. Weekly wastewater testing was initiated on June 6, 2020 and is still in progress. COVID-19 cases (bars) refer to laboratory confirmed cases as reported by the Gallatin City/County Health Department since the onset of patient testing in March 2020. SARS-CoV2 results (dots) shown for nucleocapsid gene targets 1 and 2 (N1 and N2) represent the median of 2-3 replicate samples on each date (error bars = 95% confidence limits; some dots completely cover error bars). LOD = limit of detection
Interpretation: The figure above shows that overall, case numbers have been low in the town of Three Forks. Wastewater signal has for the most part followed infection trends and remained low or undetectable. Notably, we saw almost no virus in wastewater through August and GCCHD reported only one infection for the entire month. The spike in virus in wastewater in early September is surprising as there were no reported active cases at the time. However, since false positives are unlikely to occur using this assay, virus in wastewater could reflect non-residents or asymptomatic cases. Virus levels in wastewater had disappeared in the following week’s sample.
Have a question? Check out our Frequently Asked Questions here:
For a recent review of the scientific literature regarding fecal shedding of SARS-CoV2 in symptomatic patients, please see the following:
